PHP Profiling
Talking about web applications performance with lots of people, I often see them assuming that the major bottleneck in application developing is a database. Well, it might be true for some cases, but no one pay for research paper guarantees it’s the issue in your particular situation. Moreover, some websites contain no real-time content and most of db queries are cached, but performance is still far away from perfection. How to identify the problem then?
I’ve tired using some good but not really reliable tools and techniques to figure out the slowest part of applications, e.g. built-in profilers and the microtime() function. Finally, I’ve come to the conclusion that they don’t provide me with results I actually need.
-
Built-in profilers are fine if you want just to check how much time each file or function takes to run or find last/most executed db queries, but if you want to know how time-consuming each class method is, it’s not enough. my ip The issue here is that most of such profilers are based on pre-defined framework templates and some places may eventually remain unchecked.
-
Microtime function. It’s ok to use it if you want to evaluate performance of a particular part in the code, but if you’re trying to find the slowest component, it just doesn’t work.
Luckily, I’ve found a PHP profiling solution that fits all my current needs – xdebug.profiler.
Honestly, I’ve tried it a few times before but haven’t managed to get appropriate results because of poor tools used and confusing interpretation of cachegrind format with lots of lugs (a file format used by the Xdebug profiler for function call timings).
Xdebug: installation & configuration
A few words about Xdebug. It is a PHP extension for powerful debugging that provides stack and function traces, profiling information, memory allocation, and script execution analysis.
Here is my Xdebug profiler configuration with some inline comments:
#path for generated profiles
xdebug.profiler_output_dir = "/var/data/php-profiles/"
#the file format of generated profiles. %u means timestamp. By default it's cachegrind.out.%p but it would override profiles for the same script. Not really useful if most applications have a single entry point: index.php :)
xdebug.profiler_output_name = "cachegrind.out.%u"
Note: don’t forget to disable the profiler after you finish profiling since generated files are quite large in size.
Xdebug: results visualization
There are not so many tools for cachegrind results interpretation. Most of them are presented on the official Xdebug page. I’ve personally used WinCacheGrind, but if a file becomes a few megabytes larger, WinCacheGrind just crashes. I’ve also tried a web tool called Webgrind, and it works well with big files but a little bit slowly.
What I want is to get a simple answer to the question: how much does each method “cost” me ? Moreover, I’d like to work not only with a single profile/file, but with a bunch of them, e.g. after I run something like
But none of the listed tools provide me with such an opportunity.
Well, I’ve looked into Webgrind source and created a php util to process one cachegrind file or a bulk of them and transform them into csv reports including a method name, number of calls, total self method cost, cost per call, cumulative method cost (cost with subfunctions calls) and cumulative cost per call. Quite simple, right?
Xdebug Analyzer
I can say a lot about how efficient this tool is for me, but it’s better to show you how I use it and, maybe, you will love it as well.
Options:
-f, --format Report format: table or csv
-t, --top Top number of methods to show. Could be a number or percentage: 10 or 20%
Usage:
./xdebug profiler -r report.csv cachegrind.out.1340990144_014725
#display a report table with 10 slowest methods
./xdebug profiler -t 10 cachegrind.out.1340990144_014725 cachegrind.out.1340990145_014890
#display a report table with 20% slowest methods
./xdebug profiler -t 20% /var/data/path-to-folder-with-cachegrind-files/
Output example:
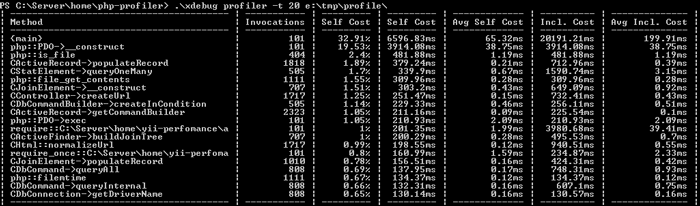
Hope you will have a chance to try it. Feel free to share your ideas and suggestions!